CompStat and Counterfactuals
Traditional CompStat meetings present crime statistics to determine if there is a particular problem in an area, and to poke those responsible to “do something about it”. Having witnessed CompStat meetings in police departments across the country, there to me are two common issues: one is there is lack of follow up to ensure people accomplished specific goals. Meetings can feel like deja-vu if you don’t pay attention to what people are supposed to be doing, and you can just rehash the same problems over and over again.
The second is even if problem areas are identified, quantitative assessment of whether what you did solved the problem tends to be superficial. Even if you cracked down on crime in one month, it doesn’t establish whether you accomplished any permanent change. Also crime can trend up or down for reasons out of your control. You want to know whether you reduced crime relative to business as usual, the counterfactual, not whether you reduced crime to zero.
To solve problem 1 is simply book-keeping. Similar to what project manager roles do in private sector tech jobs, but keeping tabs on what people said they were going to do and following up to see if they have done it is sufficient. It takes work, but is not rocket science.
The second part is more difficult, but that is where my work comes in. I have developed simple metrics to monitor crime counts over time, see mine and Jerry Ratcliffe’s Weighted Displacement Difference test, and here I will show how to amend it to fit in with CompStat style monitoring.
For example of what other people are suggesting, here is an example from the Santos’ Stratified Policing model.
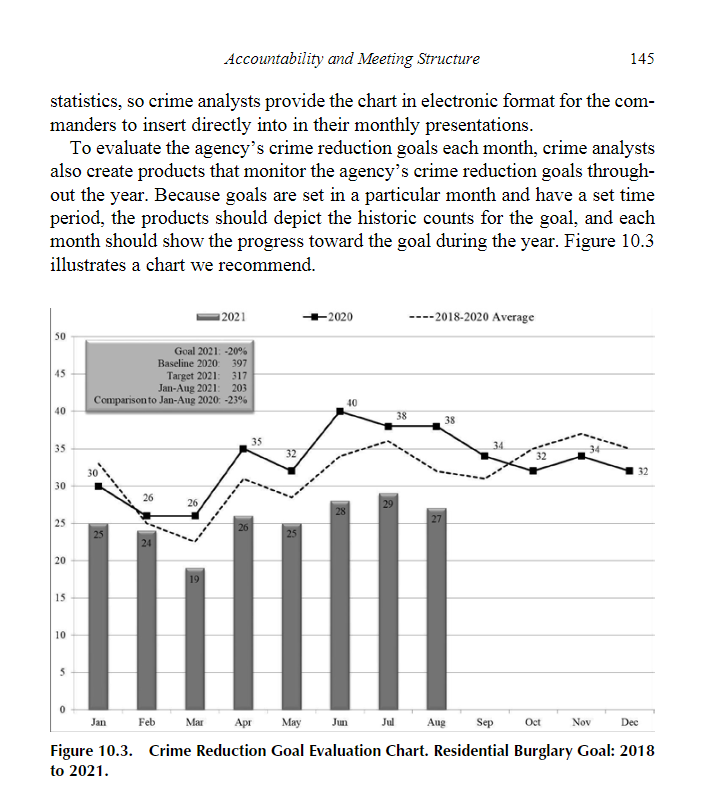
This shows setting a specific goal (Dr. Rachel Santos suggests a baseline of 20% reduction), and uses the prior year to estimate the counterfactual. I like the idea of setting a reasonable goal, I however do not like the percentage reductions. (I also do not like using the prior year comparison, crime can be trending up/down, Santos in other examples uses the same comparison area approach I do here, so I don’t take these as any major point of contention.) But I can amend the WDD test I created with Jerry for just this scenario.
So the ingredients here are:
- identify the area you are going to target
- identify a comparison area to measure the counterfactual
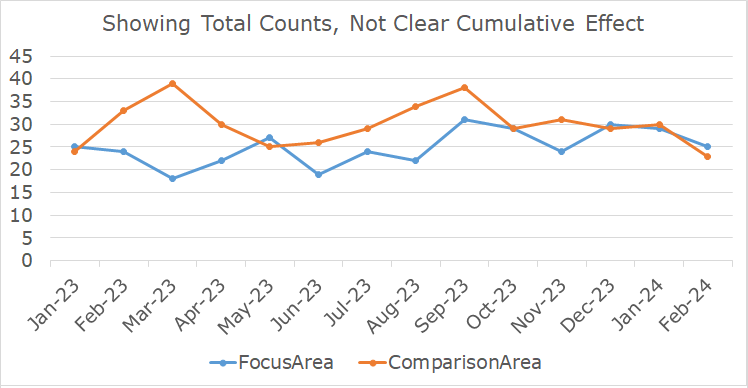
Then it is as simple as comparing the cumulative crimes in your target area vs the comparison area (you can use a comparison crime type in some scenarios as well, e.g. compare car larcenies to store larcenies). So say we have two areas, the total crime counts per month can be somewhat noisy. So even if on average your treated area is reducing crime, some months it may be higher than the comparison area.
But if we look at the cumulative difference between treated and control, we can estimate the total crime reduction so far (with confidence intervals around that estimate).
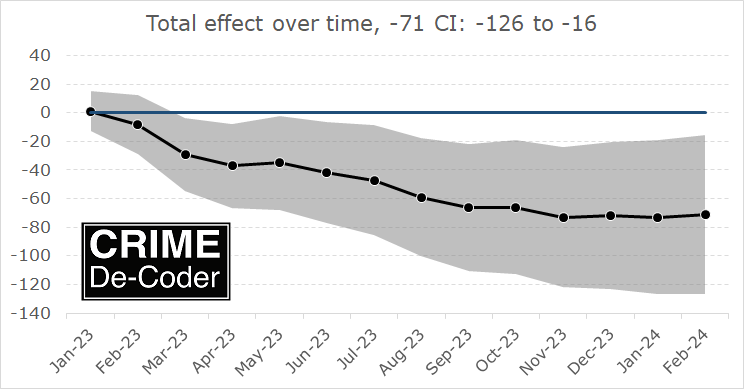
This allows you to monitor the trends over time in a specific area, and better quantify your impact. This approach can transform CompStat from I think I reduced crime to legitimate empirical evidence to back up your intuition.
The stats I promise are simple, and I have provided an Excel spreadsheet to allow your analysts to replicate these metrics (as well as metrics for normalized per time period, or a percent reduction instead of a total crime reduction). Get in touch if you would like help in applying these methods to your CompStat meetings.